This part contains information about installing and maintaining Flopsar environments.
1. Installation
Each component is installed separately but there is a common initial installation procedure for both manager and database. This procedure must be performed before any further steps can be made.
In order to run the Flopsar environment successfully, you must prepare your network so that it allows all the required connections (Fig. 4.2) to be established:
- outgoing TCP connections from agent to database instances.
- outgoing TCP connections from database instances to manager.
- outgoing TCP connections from workstation instances to manager and database instances.
1.1. Manager and Database Binaries Installation
Follow the instructions below carefully:
- copy the file
database-2.1.tar.gzto your destination machine and uncompress it. - set
FLOPSAR_HOMEenvironment variable, so that it points to the extracted directory. - optionally you can update
PATHenvironment variable to includeFLOPSAR_HOME/bindirectory. In next examples we assume that this variable has been updated accordingly. - optionally you can update
MANPATHenvironment variable to includeFLOPSAR_HOME/mandirectory. This will allow you to make use of man pages of the Flopsar binaries.
1.1.1. Manager
make sure you have completed the binaries installation procedure.
make sure your destination machine has the same IP address as the one specified in your license file. Otherwise, manager will not run.
initialize a new environment working directory
<manager_home>by executing the following command:$ fs2mgr --init <manager_home>
put your license file into the
<manager_home>/licdirectory.configure the manager
start manager by executing:
$ fs2mgr --start <manager_home>
Note
There can be no multiple instances of manager running on the same machine and using the same licence file.
1.2. Agent
In order to install agent, follow carefully the instructions below:
- copy the agent file
flopsar-agent-2.1.jarto your server machine. - configure the agent.
- optionally add your formatters.
- restart your application.
When the agent starts for the first time it does not have any configuration deployed. It just registers itself to the manager, after successful connection, and does not instrument anything.
Tip
You can verify if the agent registered to the manager by executing the following command:
$ fs2mgr --list agents <manager_home>
2. Logging
Each Flopsar module (application) uses logging levels. The levels are defined as follows:
- finest
- the most detailed logging. It should not be used during normal, production operation since it can degrade the application performance significantly. Use only in cases when you suspect some problems with the application, want to trace how it processes requests, requested by the Flopsar Technology Support to help investigate some problem, or any other problems. It prints lots of diagnostic information, which might not be covered by this manual.
- finer
- a less detailed logging than finest. Used to log some additional information about the application operation and data processing.
- fine
- a more detailed logging than info. Used to log some additional information about the application operation and data processing.
- info
- a default level used in applications. Used only to log some runtime information to verify configuration and the like. You should use this level on normal, production operation.
- warning
- used in cases when some error occurs but with no impact on the applilcation stability and data integrity.
- error
- normally, there should be no error messages in the log. The level is used in cases when some error occurs. These errors impact the application operation stability and data integrity but not all of them. The messages are informative, so you should know whether you can ignore it or not. Any system calls and external libraries errors are also logged in this level.
- fatal/severe
- there should be no such messages in the log. Messages of this level are only printed in cases when some fatal error occurred and the application cannot run any longer. For example, some misconfigured options can result in printing fatal messages in the log. Please, read them and fix your configuration. The messages are usually very informative.
3. Agent
agent is a core component. It runs on a JVM and its main goal is to collect data from applications running on the JVM and the JVM itself.
3.1. Configuration
Agents are configured by their runtime options. The following options are mandatory:
- -Dflopsar.id
- Primary identifier of a server instance. It should consist of only word characters and have no more than 62 characters. If you provide a name consisting of more characters, the agent will truncate the name.
- -javaagent
- Path to your agent file
flopsar-agent-2.1.jar. - -Dflopsar.manager
- Socket address of the manager TCP server. Agents initiate connections to this server and the connections are maintained until the agents are shutdown.
- -Dflopsar.home
- Path to the Flopsar working directory. Log files are stored in this directory.
The above options must by set, otherwise the agent will not work. For example, your configuration could look like this one:
-Dflopsar.id=MyAgent -javaagent:/path/to/flopsar-agent.jar -Dflopsar.manager=172.16.0.1:9000 -Dflopsar.home=/path/to/some/dir
There are some additional options, which are not mandatory:
- -Dflopsar.id.dyn
- Secondary identifier of a server instance. If you use this option, you must set its value V to only another JVM option, i.e. the agent will take the value of this option and execute the method java.lang.System.getProperty(V,null). The output of the method will be the effective value of the secondary identifier. If you use both identifiers, primary and secondary, the agent will combine them into a single, composite identifier. They will be concatenated by an underscore character. The composite identifier’s length is up to 62 characters.
- -Dflopsar.debug
- By default source code line numbers in exceptions stack traces are omitted. If you want the agent to preserve these line numbers set this option value to true.
- -Dflopsar.logsize
- Total maximum size in MB of log files. By default this value is set to 100. By setting this option you specify how much space log files can use.
- -Dflopsar.qsize
- Total maximum size of the agent outbound queue size in MB. By setting this option you specify how much memory the agent can use.
- -Dflopsar.qratio
- Ratio of agent outbound queue size to the maximum JVM memory size in percentages. By default this value is set to 20. By setting this option you specify how much memory the agent can use. If you specify both this option and -Dflopsar.qsize, the latter takes precedence.
For example, your extended configuration could look like this one:
-Dflopsar.id=MyAgent -javaagent:/path/to/flopsar-agent-VER.jar -Dflopsar.manager=172.16.0.1:9000 -Dflopsar.home=/path/to/some/dir -Dflopsar.logsize=200 -Dflopsar.qsize=400 -Dflopsar.debug=true
There are various places where you can add your custom JVM options, it depends on the Java software you use. Please, refer to your Java software documentation for more details about adding extra JVM options.
Important
Please, make sure that every agent uses its own, unique identifier. If there are multiple agents with the same identifiers and they connect to the same manager, their connections will be dropped by the manager everytime a new connection attempt appears from any of the agents.
3.2. Formatters
agent can be used standalone or it can be extended by means of Flopsar Extensions. Flopsar agent is a powerful engine, which is extensible by formatters. The extensions are some extra jar files, which consist of user defined POJO classes. The jars can be then included in agent deployment.
Formatter is a key feature. It enables to process data inside the instrumented methods. In order to take advantage of this feature, all you have to do is setup a configuration, create a simple POJO class and implement a single method (called formatter):
public static java.lang.String myFormatter(java.lang.Object[] args)
Warning
You can give any name to the above method but the signature of the method must be preserved. Otherwise, it will not work.
The argument of the formatter is an array of the instrumented method arguments delivered to your formatter. These are your original application objects, not clones. When you set up the configuration correctly, agent will inject your formatter code into the instrumented methods during the instrumentation. It can be injected in one of the two places, i.e. at the beginning or the end of the method. Note, your formatter code is executed inside your instrumented method, so make sure your formatter code generates minimal overhead.
Warning
If you crash your application because of badly written formatters, do not blame us. Formatters code can be written by anyone, that is why they are not supported by Flopsar Technology.
In fact, it is up to you what extra features agent will have. You can even extend your agent installation to cover a distributed transactions tracing.
Finding the best place for formatters jars can be a bit tricky and it strongly depends on your Java enviroment. You can find some tips and tricks on our GitHub page.
3.3. Data Collecting Considerations
Although, agent is designed to collect as much data as possible, we are not able to guarantee that all the instrumented methods calls data will be collected. It is because agent priority is not to crash the application it monitors. That has some serious implications on the agent design and operation. We just favor stability and reliability over data completeness.
Each call of an instrumented method, symbol or metric value is represented as a serialized entity called packet. As soon as the packet is created it is ready to be sent to a database. In order the packet to be sent it must be first put to the outbound queue. This is the point where agent decides whether put it or not. The packet is put to the queue if and only if the connection to the database is established and there is enough space in the outbound queue (the size of the outbound queue can be customized). Otherwise, the packet is dropped. This scenario holds for each packet.
3.4. Instrumentation
The fundamental feature of agent is instrumentation. This feature makes use of java.lang.instrument framework. A user configuration describes what and where to instrument (see Managing Agent Configurations for details). However, there are some classes which are always excluded from instrumentation:
com.flopsar.*
org.objectweb.*
javassist.*
org.apache.bcel.*
java.*
javax.*
jdk.*
$
com.sun.*
sun.*
When agent receives a configuration to load, it first parses it and then sorts its instrumentation rules. If there are any changes in the configuration that requires configuration reloading, agent reloads those classes that have been instrumented earlier and those which are required by this new configuration. This classes flow is passed through the configuration filters (Fig. 3.1). The are a few filters operating on two levels: class and method ones. The first filter excludes all the classes from packages, which match the internal exclusion set. Next, it goes through the second, user defined, exclusion class filter. At this point, we have all the classes we want to instrument. In the next step, all the methods from each, selected class are passed through the method filters. At this point, a class can also be excluded from configuration if any of its methods does not satisfy the filters conditions. At the end, we obtain a set of methods which are selected for instrumentation.

Fig. 3.1 Instrumentation Filter
The methods instrumentation is performed in a specific order (Fig. 3.2). First, rules with custom formatters are applied, then rules with standard formatters and finally rules without formatters at the end. For example, if there are two method rules, one instrumenting with a custom formatter and the other one instrumenting only public methods and our method is both public and its signature matches the one specified in the first rule, then the rule with the formatter will be applied.

Fig. 3.2 Instrumentation Order
3.5. Hot Methods
This feature enables you to record instrumented methods executions. The Hot methods feature is very useful, when you tune your configuration for minimal performance impact. In this way, you can easily detect the most frequently executed methods and exclude them from instrumentation, unless you really need to instrument them.
When agent starts, this feature is enabled by default. agent simply registers the number of instrumented methods executions. The Hot Methods statistics are dumped every 30 seconds to a log file (see the example below), provided that the logger level is set to at least fine level. This is done for 30 cycles and then is disabled. You can enable it later from workstation (see Hot Methods for details).
>>>>>>>>>>>>>>>>>>>>>>> Hot Methods Report [Cycles left 27] <<<<<<<<<<<<<<<<<<<<<<<<
HM [206633] -> [com/mysql/jdbc/ConnectionImpl][checkClosed\^\_()V]
HM [166145] -> [com/mysql/jdbc/ConnectionImpl][versionMeetsMinimum\^\_(III)Z]
HM [145591] -> [com/konakart/db/KKCriteria][getAsColumns\^\_()Ljava/util/Map;]
HM [109807] -> [com/konakart/db/KKCriteria][getDbName\^\_()Ljava/lang/String;]
...........
The values in the parentheses denote the number of times the corresponding method was called.
3.6. Logging
The logging levels are defined in Logging. The log files size is 100 MB in total by default but it can be changed by setting flopsar.logsize option. If the log file reaches its maximum size a new file is created. The logging framework maintains up to 5 log files.
Note
By default, agent always starts with finest logger level and after 2 minutes it is switched to info automatically. You can always change the level in runtime using workstation.
3.6.1. Logger Messages
Each logger message entry has the following structure:
DATE [LEVEL]<THREAD> Message content
where:
| DATE: | current date. |
|---|---|
| LEVEL: | current logger level. |
| THREAD: | current Java thread. |
| Message content: | |
| is self-explanatory. | |
4. Manager
manager is a key Flopsar component, which is responsible for managing the entire Flopsar environment.
4.1. Configuration
manager is managed by its configuration file <manager_home>/conf/flopsar.conf.
- server.bind.port
- This is a port of the TCP server.
- server.bind.address
- This is an IP address of the TCP server. This option is not mandatory. When the option is either empty or missing, the IP address is read from the license file. If the option value is set to *, the TCP server will bind to all existing IP addresses.
- plugins
- This is a list of enabled plugins. This option contains full names of the plugins. Entries must be comma separated. By default only one plugin is enabled:
libfs2plg_authbasic.so. If you want to use additional plugins, add their names and separate them with a comma. Flopsar Suite manager currently uses two plugins: authentication and notification. The first one is used for authentication purposes and the second one is used for notification. You can easily replace these plugins with custom ones (see Plugins for details).
4.2. Logging
manager has a single log file fs2adm.log. It is stored in manager_home/logs directory. The logging levels are defined in Logging.
You can set the logger level either during the startup procedure or in runtime. For example, to set the fine level during manager startup use the following options:
fs2mgr --start --loglevel fine <manager_home>
In order to change it in runtime, execute the following command:
fs2mgr --loglevel fine <manager_home>
4.2.1. Logger messages
Each logger message entry has the following structure:
DATE [LEVEL][PID] Message content
or
DATE [LEVEL][PID][PLG] Message content
The only difference between these two types is an additional PLG entry. This entry denotes that this particular message comes from a plugin. The rest of the entries denote:
| DATE: | current date. |
|---|---|
| LEVEL: | current logger level. |
| PID: | system process ID number of the logging process. |
| Message content: | |
| is self-explanatory. | |
4.3. FDBC Clients Authentication
manager accepts connections from three types of clients: fdbc, agent and database ones. The explicit authentication is required only for fdbc clients. workstation is a fdbc client too, so when a user logs to the workstation they are required to authenticate to manager by providing their credentials. Flopsar supports one type of authentication mechanisms: internal.
4.3.1. Internal Authentication
In order to enable the internal authentication mechanism you must add the libfs2plg_authbasic plugin library to the configuration option in the flopsar.conf file, i.e. plugins=libfs2plg_authbasic. This operation requires manager to be restarted. Users management is done by means of fs2auth executable. The following operations are supported:
Listing users
To list all the stored users execute the following command:
$ fs2auth --user-list <manager_home>
Adding users
To add a new username user execute the following command:
$ fs2auth --user-add username <manager_home>
Deleting users
To delete username user execute the following command:
$ fs2auth --user-del username <manager_home>
Checking user password To verify username user password execute the following command: ::
$ fs2auth –user-check username <manager_home>
4.4. Managing Agents Database Connections
Each agent must be connected to some database in order to send its data. The procedure of attaching agents to databases is performed by manager.
Note
The agent must be connected to the manager before you can attach it to any database.
Suppose you have a running myAgent1 agent and want to attach it to a database, which server listens on 172.16.0.12:8000. In order to do it you must execute the following command:
$ fs2mgr --retarget myAgent1=172.16.0.12:8000 <manager_home>
This operation will store this change in manager and makes the agent drop its current database connection and connect to a new database. You can see if the change has been stored by executing the following command:
$ fs2mgr --list agents <manager_home>
As a result you should see something similar:
TYPE   ID                 AGENT                                DATABASE                   CONFIGURATION
JVM  | 49132292717FA021 | kona1...........................   | 172.16.0.12:8000         | c1
JVM  | 9349FF5C62BEEB7C | kona2...........................   | 172.16.0.13:8000         | c1
4.5. Managing Clients Connections
You can always check what clients are currently connected to the manager. You can simply do it by executing:
$ fs2mgr --list clients <manager_home>
This operation will print a list of the connected clients to your console. The result will be similar to the one below:
CTYPE CID              SRC                CONNID             CONNECTION TIME       TOTAL RCV    TOTAL SNT
agent 9349FF5C62BEEB7C 172.16.0.11:41827  0000000000000001   2016-10-31 20:08:46   41.01 KB     26.00 B
agent 49132292717FA021 172.16.0.10:47977  0000000000000002   2016-10-31 20:08:49   41.01 KB     26.00 B
where:
| CTYPE: | denotes a client type. There are four types: agent, fdbc, database and unknown. The last one is set when a client is connected but not yet authenticated. |
|---|---|
| CID: | denotes a client identifier. This value is useful when you search for this client activity in the manager log files. |
| SRC: | denotes a client source socket address. |
| CONNID: | denotes a client connection identifier. This value is used when you want to specify a client connection to drop. |
| CONNECTION TIME: | |
| denotes a time at which a client connected to the manager. | |
| TOTAL RCV: | denotes a total size of data received from a client. |
| TOTAL SNT: | denotes a total size of data sent to a client. |
If you want to disconnect a client, you need to execute the following command:
$ fs2mgr --drop-client CONNID <manager_home>
where CONNID is a connection identifier.
Warning
You will not be asked to confirm whether you really want to drop a client connection. This operation will be executed immediately.
5. Database
database is a component, which provides persistence features to the Flopsar environment.
5.1. Configuration
database is configured in its configuration file <database_home>/conf/flopsar.conf. The file contains the following options:
- server.agent.address
- This is a socket address of a TCP server, which receives agents data (see Fig. 4.2).
- server.fdbc.address
- This is a socket address of a TCP server, which handles fdbc requests (see Fig. 4.2). Every workstation client connects to this socket automatically.
- fdm.address
- This is the manager socket address. You must set this option value to your manager TCP server address.
- archive.enable
- This option enables/disables the data archiving feature. It can take one of the two values: true or false.
- archive.schedule.time
- This option sets the time of day to start the data archiving procedure. This option is ignored if the archive option is set to false. It takes the value in the form HH:MM, where HH denotes an hour (0-23) and MM denotes minutes (0-59). If, for example, you want the procedure to start every day at 5:20, you just need to set this option as follows archive.schedule.time=5:20.
- archive.base.retention
- This option sets the number of hours the base data should be archived if they are older than the specified hours value. See Database Archiving for details.
- archive.ext.retention
- This option sets the number of hours the ext data should be archived if they are older than the specified hours value. See Database Archiving for details.
- archive.retention.policy
- This options sets the data archiving policy. It can take one of the two values: archive or purge. If the latter value is set, then the procedure will remove all the data that would be archived in the former case. In other words, if you want to keep your database volume size under control and you are not interested in archiving old data, you just need to set archive.retention.policy=purge. Otherwise, you must use archive value.
5.2. Logging
There is a single log file fs2db.log for database. It is stored in database_home/logs directory. The logging levels are defined in Logging section.
You can set the logger level either during the startup procedure or in runtime. For example, to set the fine level during database startup use the following options:
$ fs2db --start --loglevel fine <database_home>
In order to change it in runtime, execute the following command:
$ fs2db --loglevel fine <database_home>
5.2.1. Logger messages
Each logger message entry has the following structure:
DATE [LEVEL][PID] Message content
or
DATE [LEVEL][PID][PLG] Message content
The only difference between these two types is an additional PLG entry. This entry denotes that this particular message comes from a plugin. The rest of the entries denote:
| DATE: | current date. |
|---|---|
| LEVEL: | current logger level. |
| PID: | system process ID number of the logging process. |
| Message content: | |
| is self-explanatory. | |
5.3. Database Management
You can monitor a database instance health by dumping various statistics. These statistics include collectors subsystem states and others. You can dump the statistics on the console by executing the following command:
$ fs2db --stats <database_home>
The output Fig. 5.1 consists of collectors and overall statistics. Each collector is a matrix, whose rows represent 5-minute slots and columns 1-hour slots. When a call arrives its collector cell must be found. When the cell is found, it is appended to its execution stack and stays there until its root call arrives. Then the entire execution stack is removed from the collector. Collectors are combined into workers, which manage the collectors. Each worker has its own queue of incoming calls to process. The numbers in cells show how many execution stacks (root calls) are being collected.
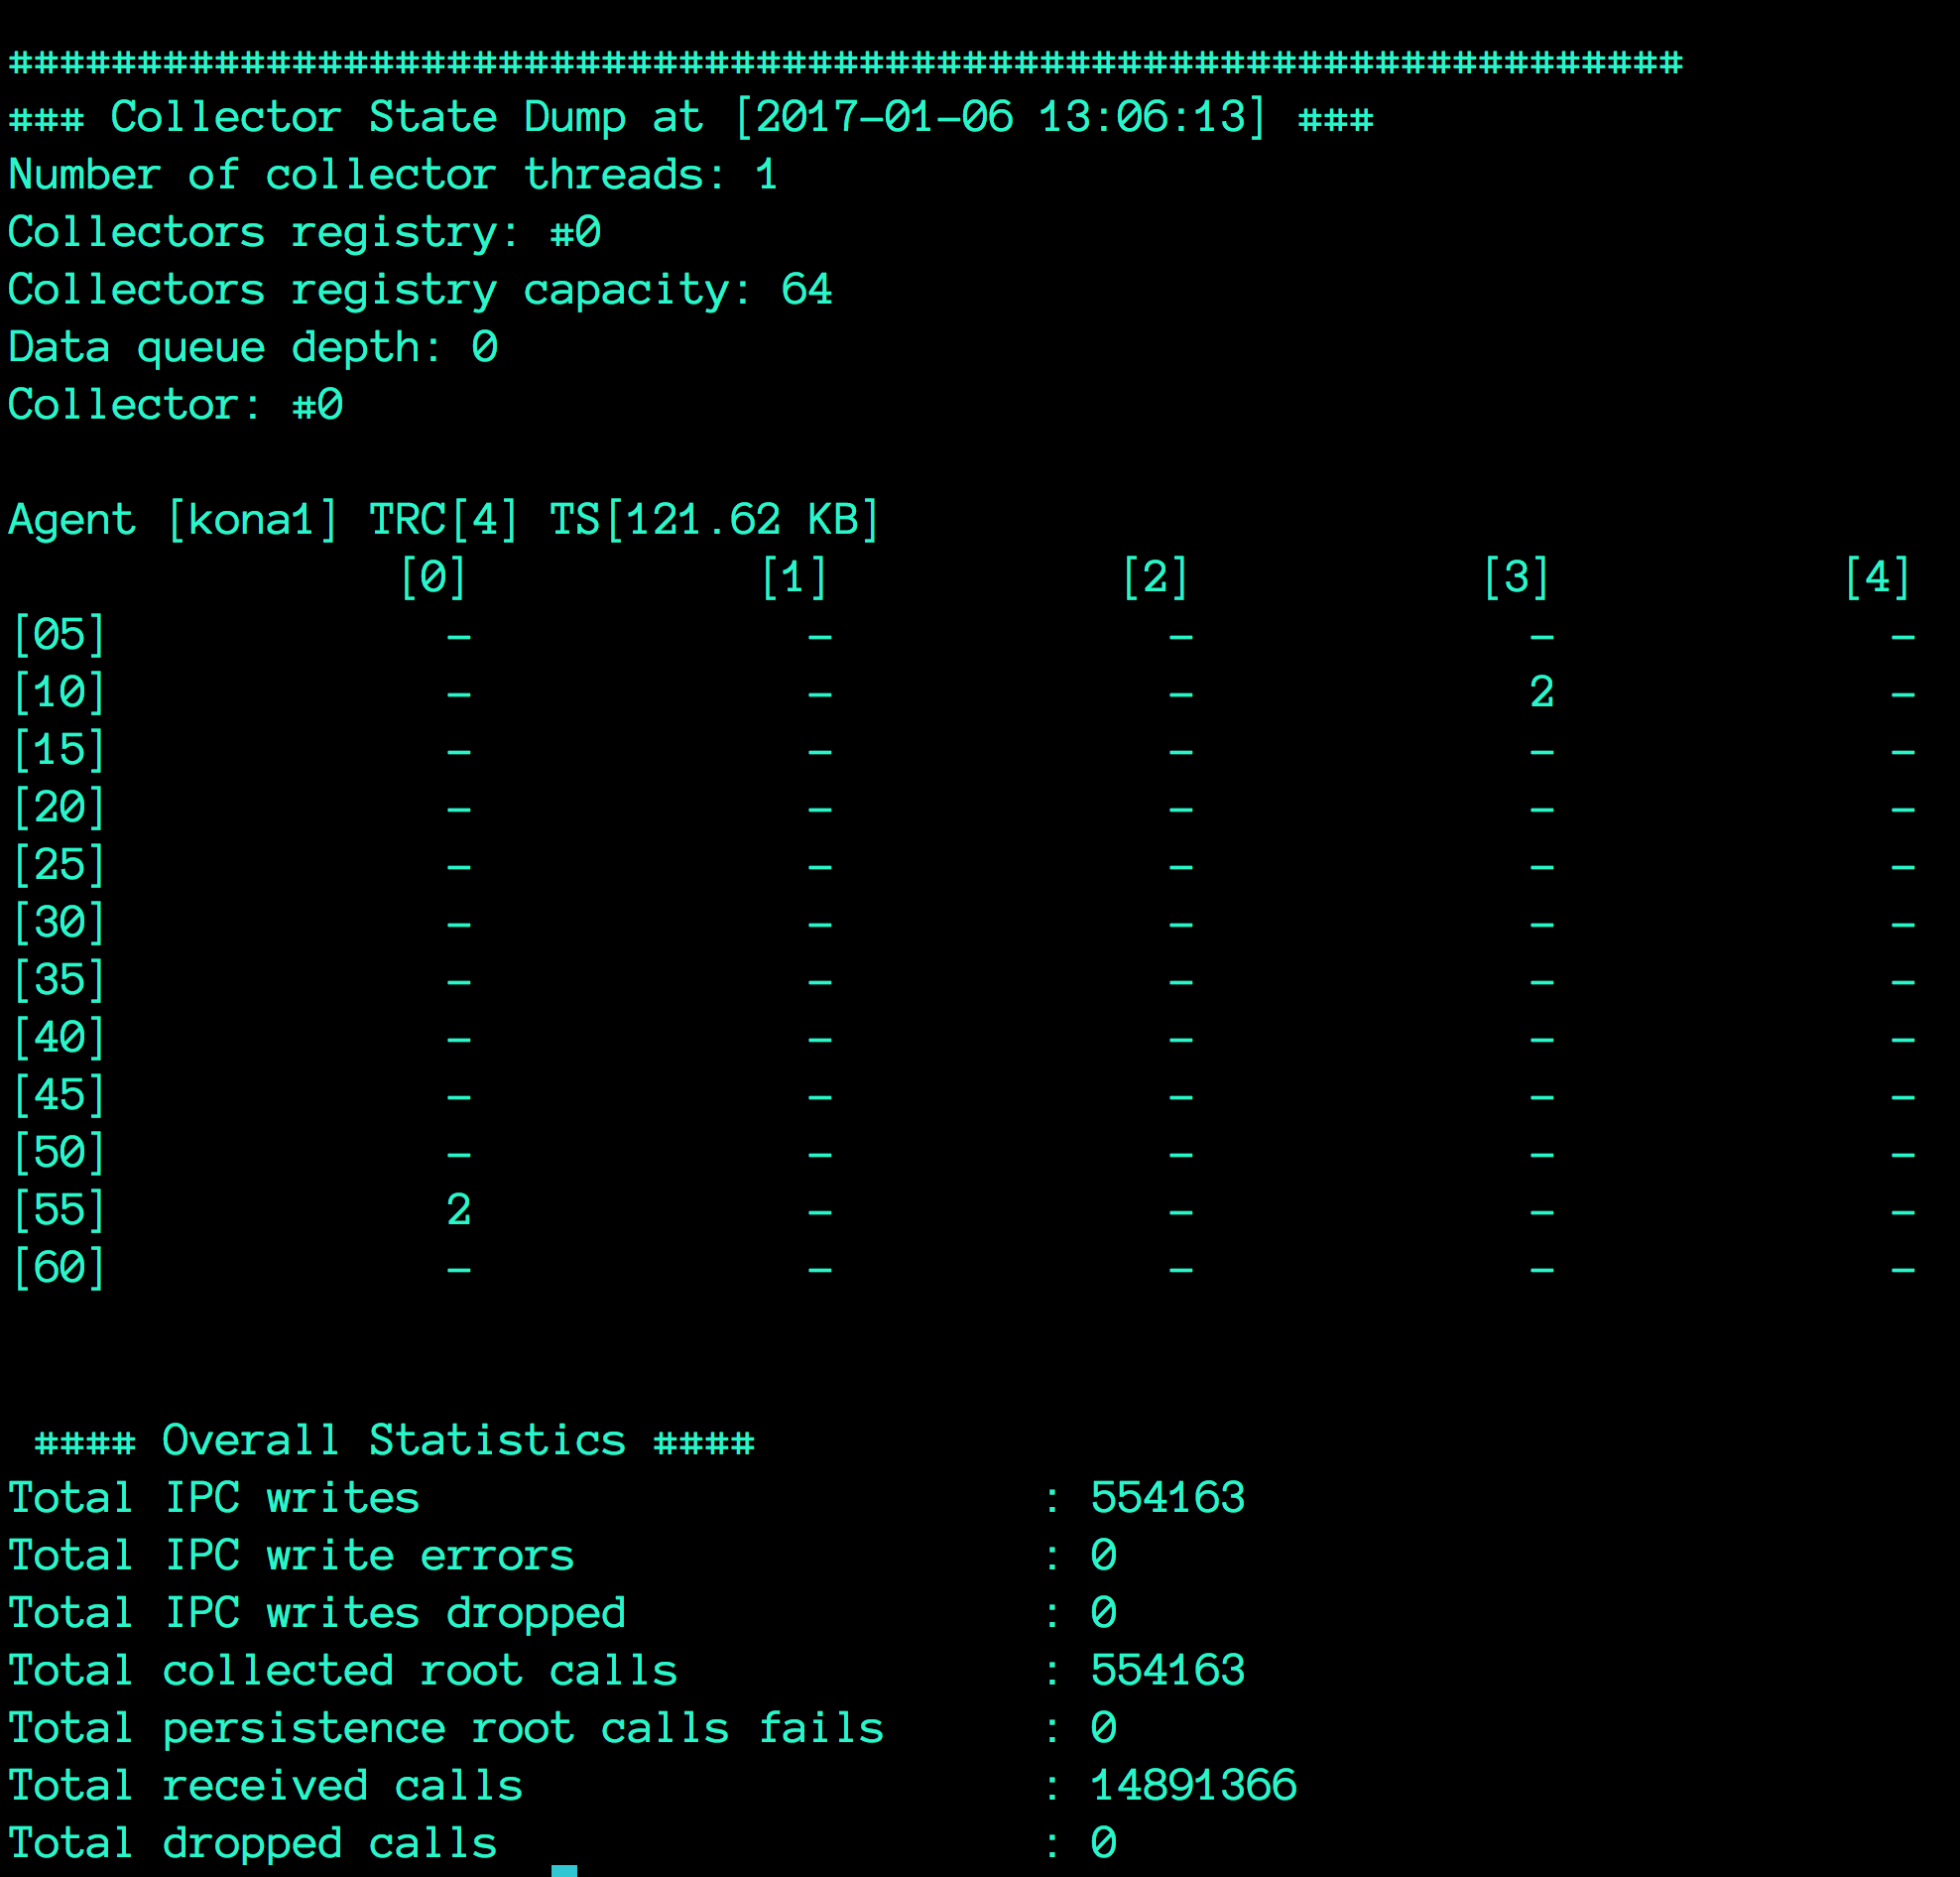
Fig. 5.1 Flopsar database Statistics Dump
For each worker, there are three metrics, which give information about its state:
| Collectors registry: | |
|---|---|
| index of the worker. | |
| Collectors registry capacity: | |
| number of collectors. | |
| Data queue depth: | |
| worker’s queue depth. | |
For each collector, there are two metrics, which give information about the collector state:
| TRC: | Total Root Calls: the number of root calls being collected. |
|---|---|
| TS: | Total Size: the total size of the collector. |
The overall statistics (covering all the available collectors) contain the following information:
| Number of collector threads: | |
|---|---|
| total number of collecting threads (workers). Each thread can handle multiple collectors. | |
| Total IPC writes: | |
| total number of root calls transferred to the FPU process successfully. | |
| Total IPC write errors: | |
| total number of failures in transferring root calls to the FPU process due to write error. | |
| Total IPC writes dropped: | |
| total number of failures in transferring root calls to the FPU process due to thread contention. | |
| Total collected root calls: | |
| total number of root calls collected and removed from their collectors. | |
| Total persistence root calls fails: | |
| total number of root calls, which have not been persisted. If this value is greater than zero, investigate the database logs. | |
| Total received calls: | |
| total number of calls, received by collectors. | |
| Total dropped calls: | |
| total number of dropped calls. A call is dropped when it is corrupted. | |
5.4. Database Archiving
Data archiving is a feature, which helps you to keep your database volume under control. If enabled, it runs every day at the scheduled time, compresses part of the data and moves the compressed data to the <database_home>/storage/arch directory. After this operation, your database volume is smaller. There are a few configuration options, which govern this procedure, the ones with prefix archive.
First of all, in order to enable the archive feature, you must set archive.enable=true option in the configuration file. To make the archiving procedure start at the HH:MM time, you must set the option archive.schedule.time=HH:MM. When the time comes, the database master process spawns a new archive process, which does the archiving. When the archiving procedure starts, it must know which data it should archive. This is managed by two, additional options:
archive.base.retention
archive.ext.retention
We distinguish two tiers of data to archive: base and ext. The latter covers all the extensions data, which are parameters and exceptions stack traces, while the former covers the remaining data. First, the procedure archives the ext data which are older than the specified number of hours of the archive.ext.retention option. Next, it archives the rest of the data, which are older than the specified number of hours of the archive.base.retention option. The idea standing behind these tiers of data is to keep the base data a little longer than parameters and exceptions. This imposes a condition on the values of these retention options, namely:
archive.base.retention >= archive.ext.retention
The procedure always produces a single file. The file is stored in the directory <database_home>/storage/arch and its name is of the form fs2.arch-YYYY-MM-DD_HHMM, where YYYY-MM-DD_HHMM is a date time of the procedure beginning. Besides the output file, there is a log file fs2.arch-YYYY-MM-DD_HHMM.log created in the same directory. The log file contains some information about the archiving operation.
If you want to only keep your database volume under control and you are not interested in old data, then you can set the option archive.retention.policy=purge. This policy makes the database delete the old data.
5.4.1. Extraction
If you want to extract the archived file, you just need to execute the following command:
$ fs2db --archive-extract <arch>
This command will extract the specified <arch> file in the current working directory. A new storage directory will be created with extracted database data. Additionally, a log file fs2-arch-extract.log will be stored with extraction procedure logs. Optionally, you can set the logger level, for example:
$ fs2db --loglevel fine --archive-extract <arch>
6. Alerts
Alerts are managed from workstation, however alerts feature must be enabled and configured before any alert rule can be added. Whenever some alert rule is defined in workstation it is persisted in the corresponding manager instance. If there are any databases connected to that instance, they get notified about the alert change instantly. They update their set of rules and start to evaluate them. How the notifications are performed is determined by the corresponding notification plugin. The notification feature is implemented as a plugin and is disabled by default. In order to enable it you must add a valid notification plugin name to the plugins option in the manager configuration file. You can either provide your own implementation of the notification plugin or use the one shipped with Flopsar.
Tip
You can always check what alert rules are currently deployed on a database by executing the following command:
$ fs2db --list alerts <database_home>
The instructions given below are only valid for the Flopsar notification plugin.
6.1. Notification Plugin
The notification plugin is an SMTP client, which sends emails when some conditions are fulfilled. The plugin makes use of CURL library.
If you plan to use this feature, you must enable this plugin as well. Follow the instructions below to enable the notification plugin:
update the plugins option to include the
libfs2plg_smtp.sovalue.copy
FLOPSAR_HOME/resources/fs2plg_smtpdirectory to<manager_home>/conf/.edit
smtp.conffile and set your SMTP server options:smtp.host: Address of your SMTP server. smtp.port: Port of your SMTP server. smtp.username: If your SMTP server requires authentication, put a valid user name here. Corresponds to the CURLOPT_USERNAME. smtp.password: If your SMTP server requires authentication, put a valid password here. Corresponds to the CURLOPT_PASSWORD option. smtp.subject: Subject of each notification email. smtp.from: SMTP sender address. Corresponds to the CURLOPT_MAIL_FROM option. smtp.verbose: Verbose mode used to display a lot of verbose information. Corresponds to the CURLOPT_VERBOSE option. smtp.ssl.enabled: Corresponds to the CURLOPT_USE_SSL option. smtp.ssl.verify_peer: Corresponds to the CURLOPT_SSL_VERIFYPEER option. smtp.ssl.verify_host: Corresponds to the CURLOPT_SSL_VERIFYHOST option. edit the
smtp.recipientsand add subscribers’ email addresses (one per line).edit the
smtp.textand set your own message template.
When you set your own message template, you have some variables at your disposal:
| $FS2_AID: | Alert identifier. |
|---|---|
| $FS2_VAL: | The monitored component value. |
| $FS2_DATE: | Alert generation time. |
| $FS2_AGENT: | agent identifier. |
| $FS2_COMPONENT: | Component name. |
| $FS2_TWINDOW: | Time window of the alert rule. |
These variables will be replaced with their corresponding values. Below, you can see a sample message (smtp.text content):
<html>
<body>
This is my sample alert message template!<br/>
<b>Agent</b>: $FS2_AGENT<br/>
<b>Component</b>: $FS2_COMPONENT<br/>
</body>
</html>
If you want to check if the plugin configuration is valid, you can execute the following command (see Plugins for more details):
$ fs2mgr --plugins test <manager_home>
In this case, this command will make the plugin send an email to all the subscribers.
Note
You can change the plugin settings in runtime. All the changes will be automatically reloaded in runtime, after you save the configuration files.
7. Troubleshooting
When I start manager I get the following error:
There is another Flopsar Database Manager running. You cannot run another Flopsar Database Manager using the same license.
This message means you are attempting to start a manager instance on a machine, which already has another manager instance running on. Either use another licence file or another machine.